
Test Signal based Speed Estimation for Induction Machines
Heiko Zatocil, Bernhard Piepenbreier
Chair of Electrical Drives and Machines, University of Erlangen-Nuremberg
Abstract
The electrical and magnetic behaviour of a standard induction machine, excited by an alternating test signal is investigated. It is shown, that the magnetic behaviour of the rotors surface determines the electrical test signal behaviour of the machine. The stator has hardly influence on the measurable test signal impedances. The test signal behaviour of the machine can be described by a test signal based reference model, which also takes advantage of the symmetries presented in the paper. An estimation scheme is presented which is investigated via measurements on two standard induction motors.
1 Introduction
There is still no sensorless control method for induction machines which allows safe operation at every speed and load. In the zero-frequency speed range saliency-based and in the higher speed region model-based methods are preferred [1]. The saliency approaches assume well-defined saliencies, but as they are influenced by many factors (saturation, load etc.) this is not true a priori. In the first part, the integral test signal behaviour of a 15 kW standard induction motor is examined via finite element analysis (FE), while former investigations based on FE analysis only considered the influence of a single saliency [2] or the test signal itself impacts the saturation [3]. In the second part,a test signal based reference model is presented which deals with the machines symmetries. A novel sensorless control method which was introduced in [4] is presented.
2 Test Signal
For examining every spatial angle of the machine the selected voltage test signal has an alternating nature. The test signal is added to the fundamental wave voltage and follows the description:

wherein Uˆhfis the amplitude, ωhfis the frequency and ϕhfis the spatial orientation of the test signal inthe stator fixed reference frame. Also, a complex test signal impedance is defined as:
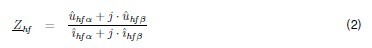
wherein ˆhf αandˆhf β describe the amplitudes of real and imaginary parts of the voltage test signal andˆhf αandˆhf β describe the amplitudes of the associated complex test signal current.
3 Finite Element Analysis
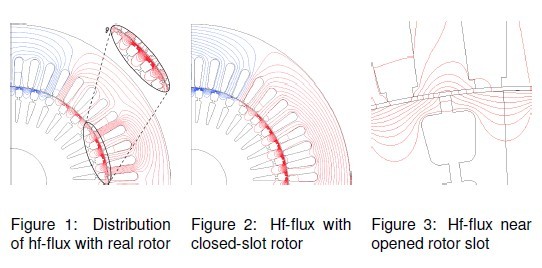
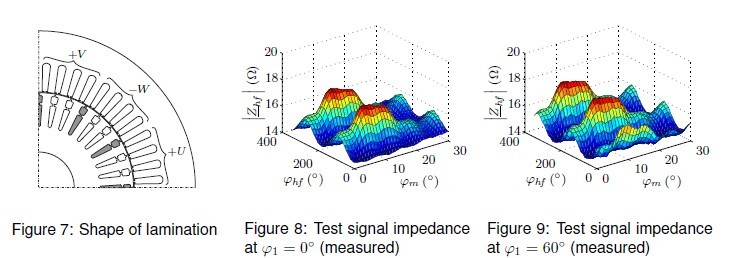
The shape of the lamination of one pole pitch of the investigated machine is depicted in Fig. 1. The rotor has thirty-six slots, whereof twelve are opened and twenty-four are closed. The machine was modelled in FLUX2D [5], neglecting effects like skewing, hysteresis and anisotropies in the lamination.
3.1 Distribution of hf-flux
First, the idle machine is not magnetised but only excited by the test signal. The hf-flux distribution for a machine whose rotor has solely closed slots is depicted in Fig. 2. Due to the high frequency of the test signal, the hf-flux only penetrates the surface of the rotor and it is distributed sinusoidally along the air gap, which is a fundamental assumption of the space phasor theory. In contrast, the distribution in the actual machine is distorted heavily by the opened rotor slot brigdes (Fig. 1), as these opened bridges are three times bigger than the air gap. Thus, the hf-flux field lines cross the air gap twice rather than crossing the opened bridges (Fig. 3). As also predictable in the field patterns in [2, 6], these field deformations are also present while the machine is magnetised and the rotor slot bridges saturate.Hence, the machine cannot be excited in a desired spatial direction, as described by the space vector theory. As a consequence, the scanning of the machines circumference for the point of the highest saturation leads to errors.
3.2 Influence of Saturation
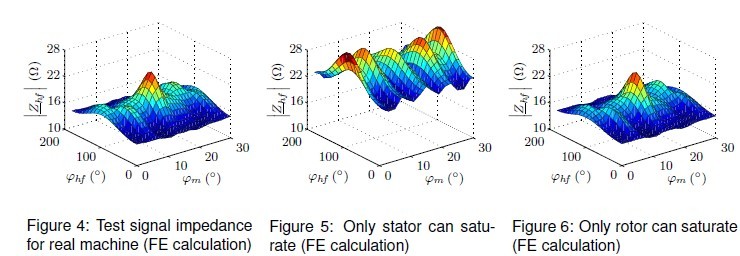
The idle machine was excited by the voltage test signal and magnetised to nominal rotor flux linkage.The shape of the test signal impedance for the actual machine at ϕ1= 0◦ is depicted in Fig. 4. For analysing the impact of the rotors and stators saturation on the test signal behaviour seperately, the properties of the magnetic materials in FLUX2D were changed — a constant relative magnetic permeabilityRdisables the saturation in the associated part of the machine. First, the relative magnetic permeability of the rotor was set to a high and constant value, whereas the attributes of the stator kept unchanged. Thus, Fig. 5 shows the influence of the stators saturation on the test signal impedance. Note, that the values are not solely determined by the stators saturation but also by the opened rotor slot bridges. If only the rotor can saturate the impedance surface is as depicted in,Fig. 6. It becomes obvious, that the resulting test signal behaviour is very similar to the machine with normal saturation behaviour (Fig.4). Thus, the test signal behaviour of the actual machine is mainly determined by the magnetic properties of the rotor and hardly influenced by the magnetic conductiv-ity of the stator.
4 Test Signal Based Reference Model
For constant rotor flux linkage, the detectable test signal impedance can be described by a test signal based reference model:

wherein ϕmis the mechanical angle, f2 is the slip frequency, ϕ1 equals the angle of the stator current space vector in the stator fixed reference frame and ϕhfis the test signal angle. No extra sensors are required for measuring the reference model [4]. As shown in [7], the measurement effort can be reduced severly by using a rotating test signal. Using symmetries in the test signal behaviour of the machine also reduces precommissioning effort. First, a 180◦ periodicity respective to ϕhfis observable, as this at least only shifts the phase of the test signal. Secondly, the twelve opened rotor slots lead to a 30◦ periodicity respective to ϕm. But also a symmetry respective to ϕ1 is useful. Fundamentally, the test signal impedance has a 180◦ symmetry respective to ϕ1, as saturation depends on the amplitude but not on the sign of the magnetic flux density. As shown next, for symmetric constructed three-phase machines this even results in a 60◦ symmetry. For the generation of a certain stator current space vector, the phase currents follow the equations:
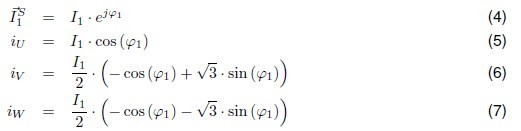
Hence, for ϕ1= 0◦ and ϕ1 = 60◦ it follows:

It becomes obvious, that phase U and phase W interchange their part as the stator current space vector rotates by 60◦. If the machine is symmetric and the stators phase belt is an integral multiple of the rotor tooth pitch, the saturation phenomena at ϕ1 = 60◦ are shifted by 60◦ (electrical) but equal to those at ϕ1= 0◦. Thus, the same values of the test signal impedance are measurable, shifted by 60◦ (electrical).
This context is depicted in Fig. 8 and Fig. 9. Note, that these test signal impedance profiles differ from that shown in Fig. 4 - Fig. 6, due to the skewing of the rotor which cannot be considered in the FLUX2D model. For unbalanced machines or if the stators phase belt is not an integral multiple of the rotor tooth pitch, an additional shift in the mechanical angle appears.
If all assumptions for the three presented symmetries (as to ϕhf, ϕm, ϕ1) are asured, these symmetries can be included in the reference model, resulting in less precommissioning and memory requirements for the test signal based reference model.
5 Estimation Method
The description of the test signal based reference model (Eq. (3)) shows that the complex impedance also depends on the slip frequency f2. As shown in [4], the slip frequency can be estimated by a comparison between the actual measured impedance curves during the machines operation ZMhfand the values from the reference model ZRhf . As mentioned above, the test signal angle ϕhfis a known value, also during sensorless operation. In addition, the angle of the stator current space vector ϕ1 can be measured. Thus, the current mechanical angle ϕmand the slip frequency f2 are the unknown parameters for the reference model. But for a fixed pair of a proposed mechanical angle ϕ′m0 and slip frequency f2′ , all mechanical angles can be computed. The differences between the magnitudes of the measured values and their opposites in the corresponding reference curve can be calculated:
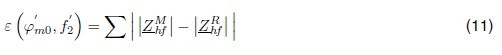
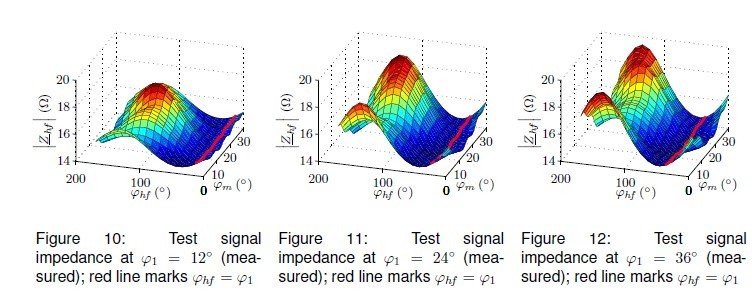
The error value ε is calculated for several combinations of ϕ′m0andf2′ . The combination of ϕ′m0and f2′ for which the error ε has a minimum corresponds to the current mechanical values of the machine and therefore represents the estimated values. As the test signal angle has to be changed in order to measure a significant profile of ZMhf , an important phenomenon is observable. Fig. 10 - Fig. 12 depict the measured test signal impedance profiles for different angles of the stator current space vector while the machine stopped. The red lines mark the test signal impedance values while ϕhf= ϕ1. In this case, the test signal impedance hardly depends on the mechanical angle. In addition, the corresponding profiles vary only slightly with the angle ϕ1. As shown in [7] this effect cannot be used for sensorless control for the investigated machine. Thus, if the test signal angle ϕhfrotates with the same frequency as ϕ1and is perhaps in the same range, ZMhf remains approximately constant. As a consequence, the estimation method fails because the measured profile is not significant. For avoiding this, the rotating direction of the alternating test signal is always in the opposite of the stator current space vector. This may result in a change of the test signals rotating direction during sensorless operation, but this is unproblematic.
6 Experimental Results
The presented method was implemented on a dSPACE-System and tested on two standard induction machines (technical data see [7]). During all measurements the machines were kept at ambient temperature. Machine 1 corresponds to the machine investigated by the finite element analysis. A rotating test signal is used instead of the alternating test signal but this has quite no effect on the measurable test signal impedance curves [7].
6.1 Reference Model
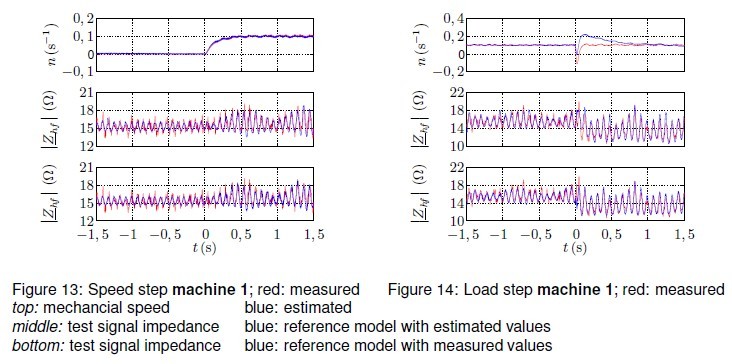
In order to get an information about the quality of the estimation, the measured test signal impedance curves are compared to the curves from the test signal based reference model during machine operation with speed sensor. The transients during a step in the reference speed are depicted in Fig. 13. The diagram in the middle shows the measured impedance curve (red) and the values from the test signal based reference model (blue), working on the estimated values. In contrast, the blue line in the diagram at the bottom of Fig. 13 marks the reference curve, when the measured slip frequency and the measured mechanical angle is used as input values of the reference model. Due to the minimal errors between the depicted curves, it becomes obvious, that the reference model (Eq. (3)) represents the test signal behaviour of the machine. Thus, the error between the measured impedance values and the reference impedance values can be used for the estimation of the slip frequency and the mechanical angle. This conclusion gets also confirmed by Fig. 14, wherein the impedance curves during a load step are shown.
6.2 Sensorless Control
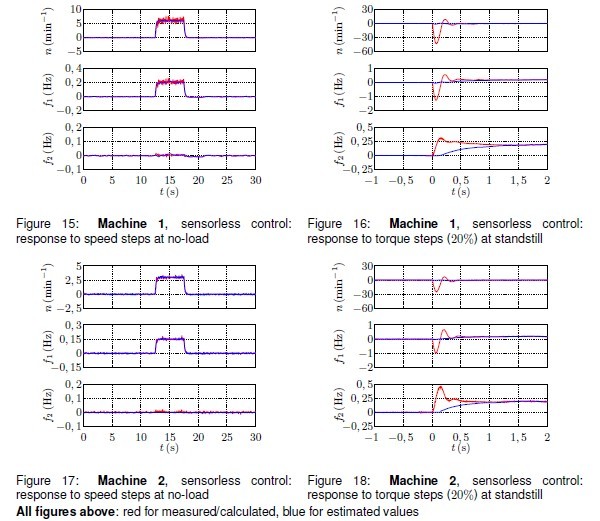
Fig. 15 - Fig. 18 depict the speed, the slip frequency, and the frequency of the rotor flux f1 during sensorless control. The values for f1 were obtained by differentiation of the flux angles. The value declared as measured was calculated by a current model using the actual measured speed. The estimate was derived by a hybrid flux model using the estimated speed [8].
The responses to steps in the reference speed at no-load operation are depicted in Fig. 15 and Fig.17. The actual and the estimated slip frequencies are zero. Thus, the mechanical speed is directly proportional to f1. The behaviour during a load step 20% of nominal torque is shown in Fig. 16 and Fig.18. It becomes obvious that the method allows safe operation even at standstill and zero frequency for both machines.
7 Conclusion
The results achieved with the FE model show, that the magnetic behaviour on the surface of the rotor has a strong impact on the electric test signal behaviour of the machine. The opened and closed rotor slots as well as the saturation on the rotors surface determine the test signal impedance, whereas the stator has hardly influence. A test signal based reference model was introduced which represents the test signal behaviour of the machine. The utilisation of the symmetries in the test signal impedance profiles lead to a decrease in the measurement effort for the reference model. Due to the magnetic behaviour the rotating direction of the alternating test signal should be in the opposite of the stator current space vector. The proposed estimation method was tested on two standard induction machines. It allows save machine operation at standstill (loaded and unloaded) and even at zero frequency.
References
[1] P. Vas, Sensorless vector and direct torque control. Oxford: Oxford University Press, 1998.
[2] J.-I. Ha, S.-K. Sul, K. Ide, I. Murokita, and K. Sawamura, “Physical understanding of high frequency injection method to sensorless drives of an induction machine,” IAS, 2000.
[3] A. Consoli, G. Scarcella, and A. Testa, “An alternative to high frequency current detection techniques for zero speed sensorless control of ac motor drives,” EPE-PEMC, 2002.
[4] H. Zatocil, “Physical understanding of multiple saliencies in induction motors and their impact on sensorless control,” SPEEDAM, 2008.
[5] FLUX2D, User’s guide, vol. 1-5. Grenoble: CEDRAT, 2006.
[6] A. Consoli, G. Scarcella, G. Tutino, and A. Testa, “Finite element analysis of flux angle estimation techniques based on high frequency signal injection,” SPEEDAM, 2000.
[7] H. Zatocil, “Sensorless control of ac machines using high-frequency excitation,” EPE-PEMC, 2008.
[8] H. Zatocil, “Rotor speed estimation based on reference measurements,” PCIM, 2009.